

UTool is a webapp fully developed by UPV researchers for the analysis of big data collected from social networks. Some of its fields of application are:
Presentation
INFRASTRUCTURE
This application has been developed using Django, the most popular Python web
framework.
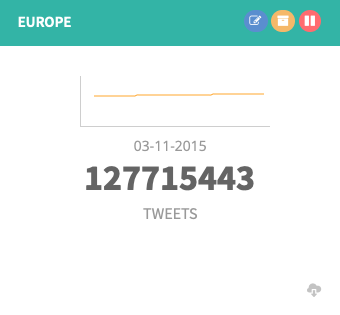
Raw data begins being collected by the application when a user creates a new “collecting task”
for a hashtag, a geographical area, or both. UTool will query a social network and the upcoming flow of
tweets will be filtered and saved in a distributed system based on HDFS and Parquet designed for massive
storage scalability. Data is then ready to be processed with any of the analytic tools available, and
this is performed using efficient and parallel big data computing libraries such as Dask.
Finally, an easy to use web frontend presents the computation results to the user in a visual way.
ANALYSIS TOOLS
The toolkit offered by UTool provides utilities to analyze social network data based on three essential axes: spatial location, social interaction amongst users, and emotional load of the text.
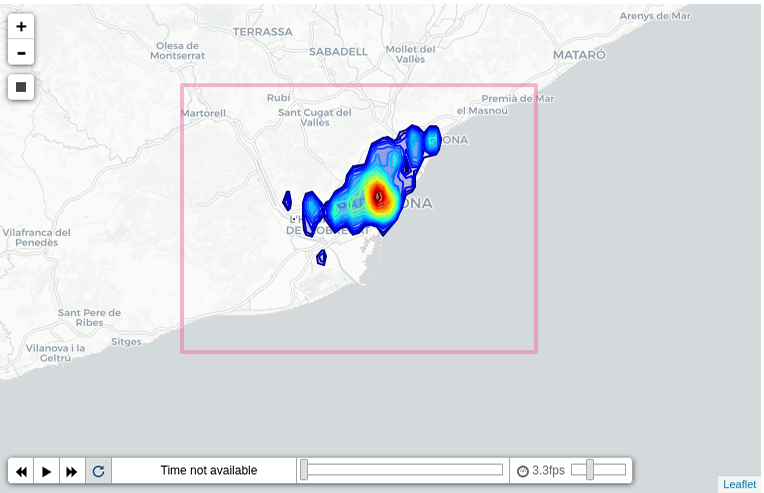
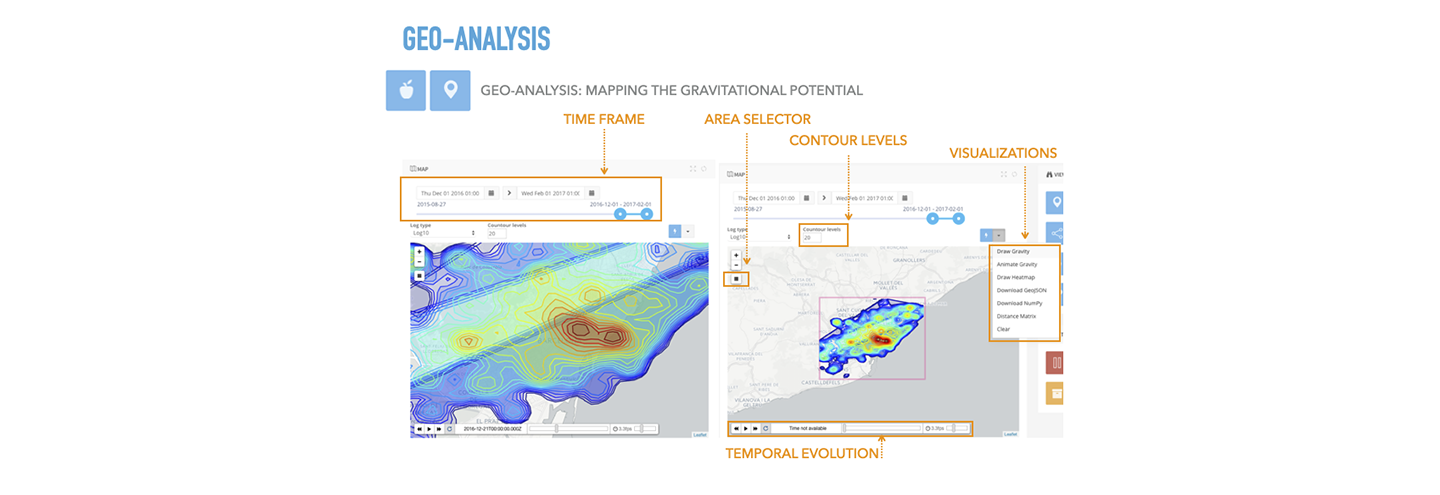
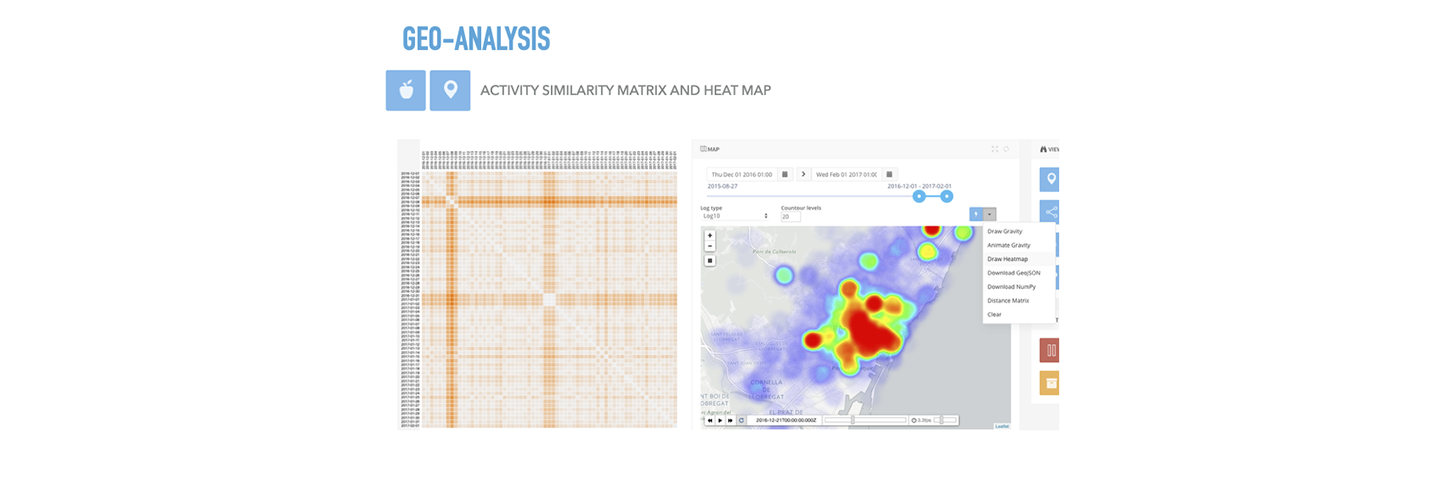
Geographic
Visualization of the tweets distribution over a raw map.
Visualization of tweet density over a custom GeoJSON pattern
(delimiting areas by country, continent, region, urban district...)
Gravitational potential maps, either static or dynamic (animated as a function of time).
Heat maps.
Distance matrices.
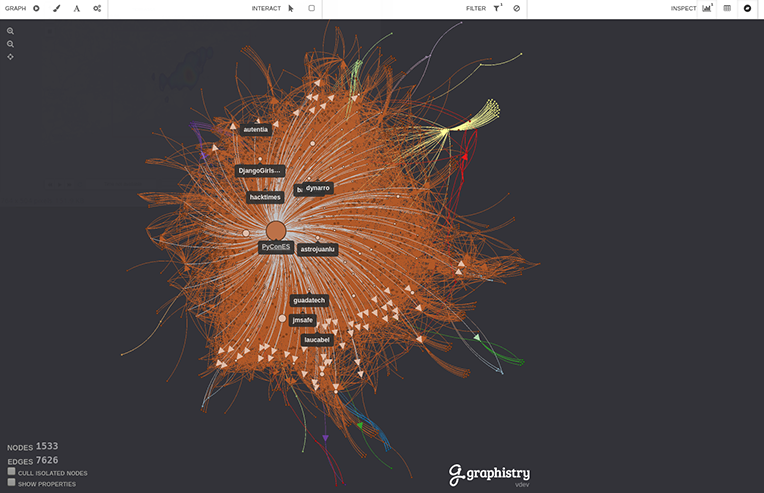
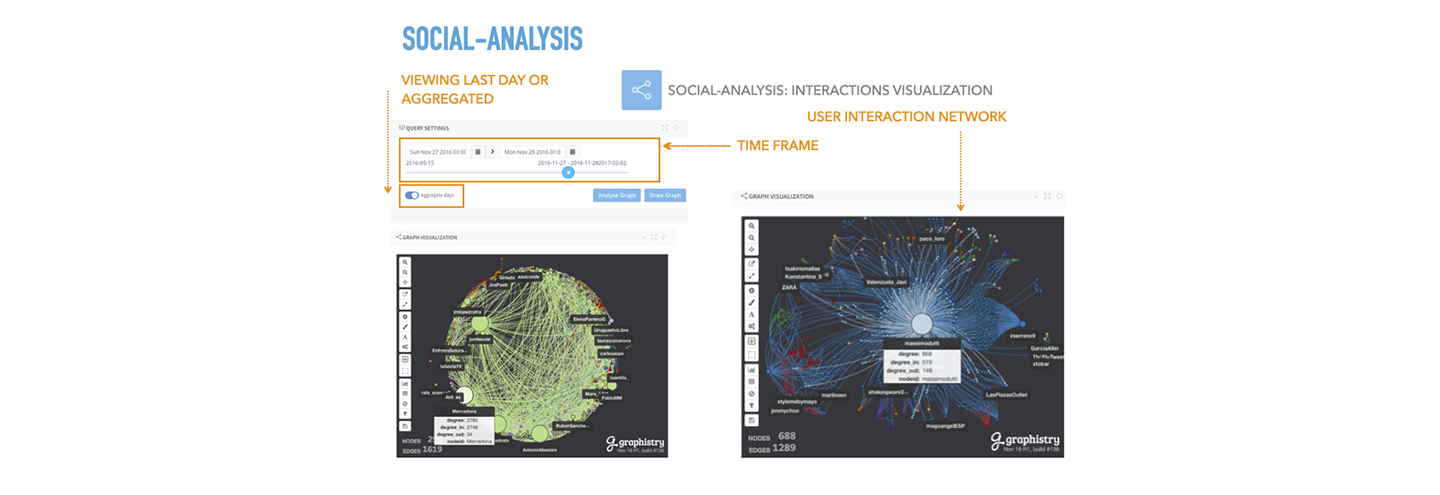
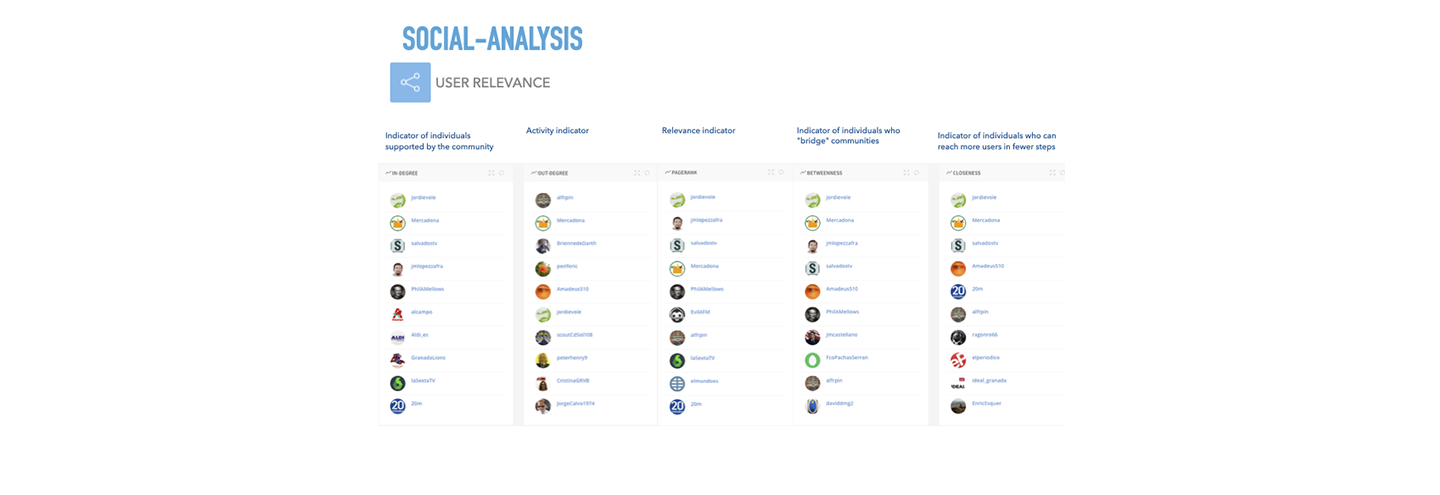
Social
Complete graphic representation of the social network of a
task in the form of nodes (users) and edges (interaction). Visualization of pagerank and communities.
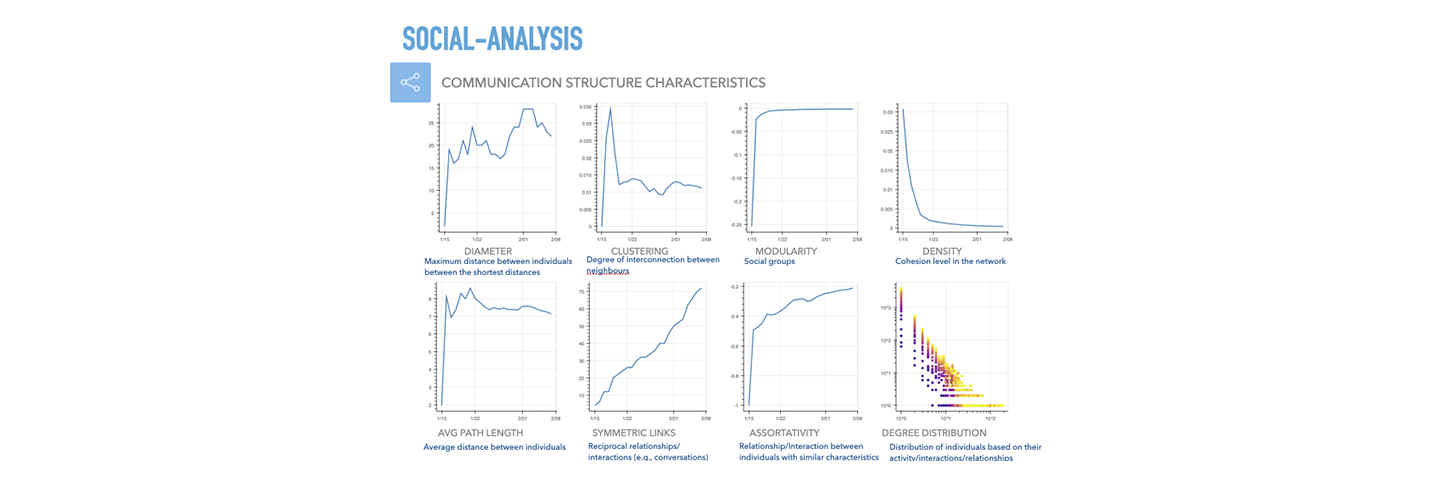
Numerous charts measuring relevant social analysis metrics,
such as clustering, modularity, degree distribution, average path length and more.
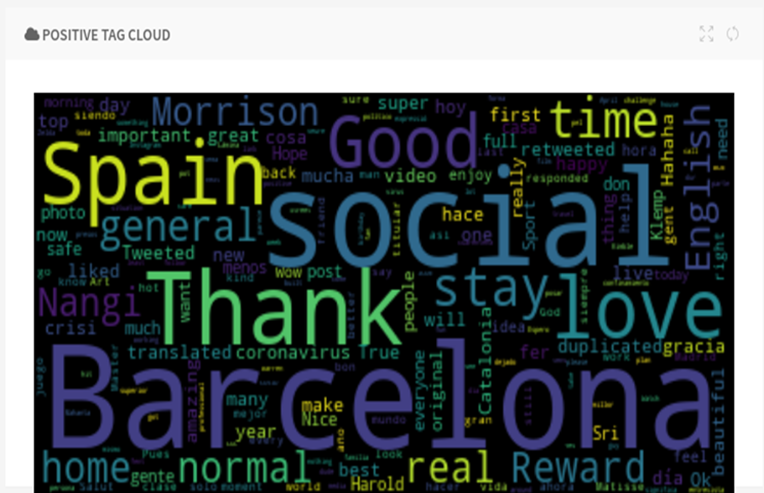
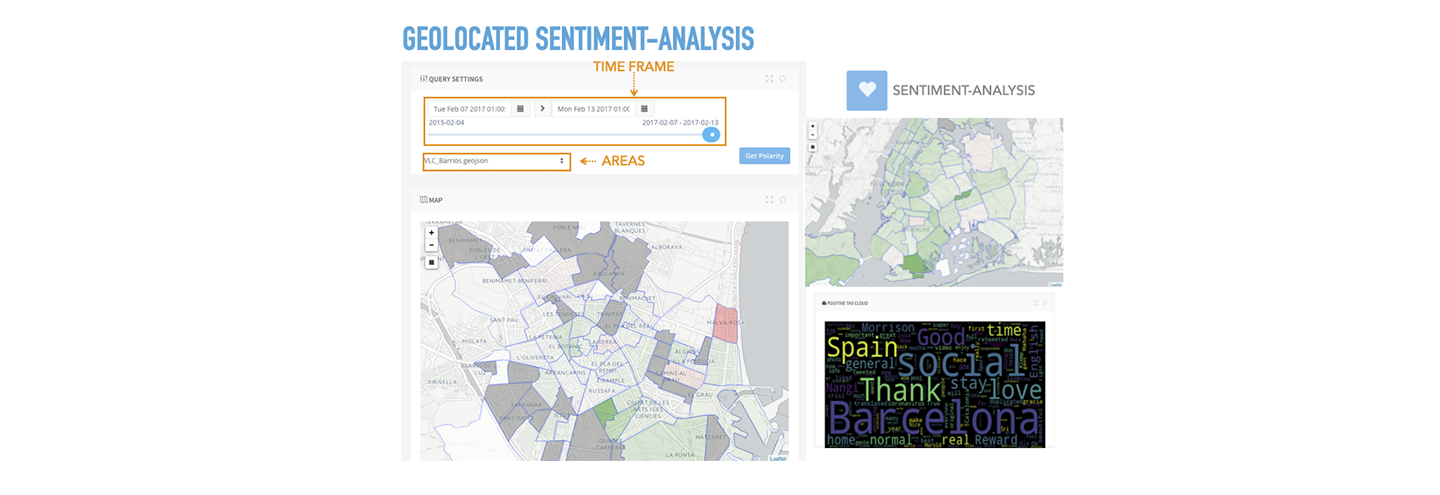
Sentiment
Location of positive, neutral and negative messages
over a map or GeoJSON pattern.
Chart displaying evolution of sentiment over time.
Tag clouds with most frequent words linked to positive and
negative emotions.
Contact us to request a demo
Our developers will contact you for the free demo.The request may take a few days to be answered.
Request Demo